Click for the interactive map for the graphic above.
https://www.worlddata.info/populationgrowth.php#:~:text=Global%20population%20growth%20is%20the%20result%20of%20birth,our%20planet%20with%20a%20growth%20rate%20of%200.9%25.
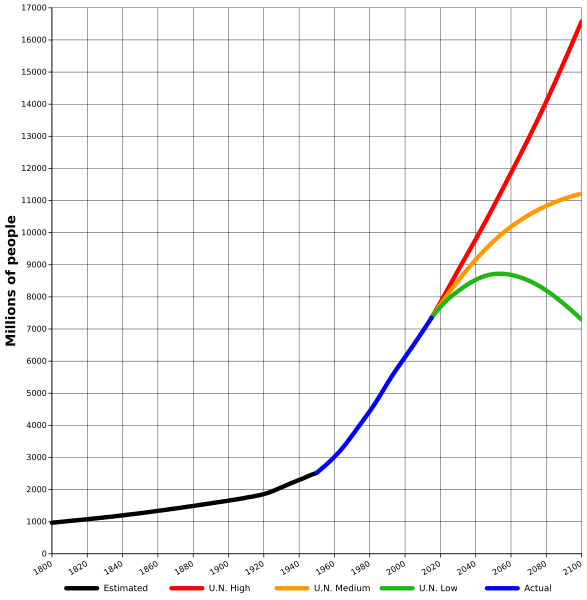
The graphs above show the very rapid growth of the world population. The is largely due to vast improvements in public health care and sanitation.
Fortunately economic improvements lead to reduced birth rates. The world population growth has been very rapid. It slows, though, as countries become more affluent - people marry later, space their kids, start having children later, and have fewer children. And affluence leads to better birth control. And retirement plans replace children to take care of parents when they get older.
It is true that the poorest areas continue to have the most children. Advanced economies like the USA, Europe, and Japan have much lower birth rates. Most of the growth in the USA is from immigration.
Negative population growth results from a replacement rate lower than 2.1. Countries such as Japan and China have reached this rate. Much of Europe has also reached that rate.
Current projections show a continued increase in population in the near future (but a steady decline in the population growth rate), with the global population expected to reach between 7.5 and 10.5 billion by 2050.
[2][9][10] Various longer-term estimates predict further growth, stagnation, or even overall decline in the global population by 2150.
[11] Some analysts have questioned the sustainability of further world population growth, citing the growing pressures on the environment, global food supplies, and energy resources.
[12][13][14]
https://en.wikipedia.org/wiki/World_population
The table below shows historical and predicted regional population figures in millions. The availability of historical ...en.wikipedia.org/wiki/Population_growth
Annual population growth rate in percent, as listed in the CIA World Factbook (2011 estimate). Growth rate of world population (1950-2050). Population of the ...www.worldometers.info/world-population/
World population has reached 7 billion on October 31, 2011. ... historical, and futureworld population figures, estimates, growth rates, densities and demographics.geography.about.com/od/obtainpopulationdata/a/worldpopulation.htm
Discover the current world population and historic world population totals andgrowth since the year one, from your About.com Guide to Geography.www.slate.com/.../world_population_may_actually_start_declining_not_...
Jan 9, 2013 – This is a counterintuitive notion in the United States, where we've heard often and loudly that world population growth is a perilous and perhaps ...- - Report images
www.prb.org/Educators/.../HumanPopulation/PopulationGrowth.aspx
World Population Growth, 1950–2050. Source: United Nations Population Division, World Population Prospects, The 2008 Revision.[PDF]www.worldbank.org/depweb/beyond/beyondco/beg_03.pdf
factors to consider when thinking about development. In the past 50 years the worldhas experienced an unprecedented increase in population growth (Figure ... [PDF]www.un.org/esa/population/publications/.../WorldPop2300final.pdf
lation size and growth, and demographic indicators. The results from the most recent set of estimates and projections were published in World Population ... International Data Base (IDB) World Population Growth Rates: 1950-2050. www.vaughns-1-pagers.com/history/world-population-growth.htm
A summary chart of the world's population from 10000 BC to 2050 AD.
The graphic below shows population density by country.

Sources
https://en.wikipedia.org/wiki/Zero_population_growth
https://www.worldometers.info/world-population/
https://ourworldindata.org/world-population-growth
https://www.worlddata.info/populationgrowth.php#:~:text=Global%20population%20growth%20is%20the%20result%20of%20birth,our%20planet%20with%20a%20growth%20rate%20of%200.9%25.


.png/300px-World_population_growth_(lin-log_scale).png&imgrefurl=http://en.wikipedia.org/wiki/Population_growth&h=180&w=300&sz=13&tbnid=N6gxyav5GVO1yM:&tbnh=90&tbnw=150&zoom=1&usg=__J05S7ujYV_WiXreyqv--q4fFriA%3D&docid=kox2yK0--cmxsM&hl=en&sa=X&ei=qhibUbXRK5Pg8AT654DwDw&ved=0CGAQ9QEwBw "http://en.wikipedia.org/wiki/Population_growth")


